The dazzlingly didactic dropper
Start by having a look at the dropper  in action
(mpeg movie). This quirky Lego system is designed to investigate the
dynamics of objects falling through air under the influence of gravity.
Believe it or not, it can measure the gravitational acceleration and
quantify the effects of aerodynamic drag.
At first sight, the system would appear to do little more than repeatedly drop a ball, catch it, and return it to the start position. While this is all good fun, the didactic element is encapsulated in the two sensors: the microphone at the bottom, and the light sensor that slides up and down the pillar.
The microphone detects the moment of impact, while the light sensor registers the ball as it flies past. We can therefore measure the time it took the ball to travel between the light sensor and the catcher. We can also measure the distance between these two locations (with a ruler) and hence arrive at one point on the ball's distance-time graph. By repeating this process for different light sensor positions, we can obtain more points on the distance-time graph.
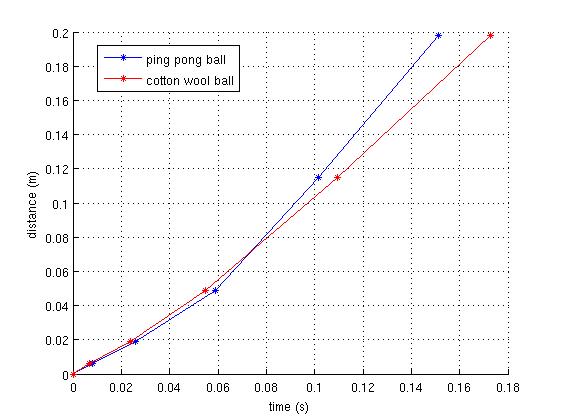
Above are the results of two experimental runs, one with a ping pong ball, the other with a cotton wool ball. The t=0 data point corresponds to the highest light sensor position, which is just below the jaws (see video). At this point, the ball would have already picked up some speed, so we would expect the distance-time graph to be of the quadratic form s = ut + 1/2 a t2. The numpy.polyfit() function can easily find the quadratic polynomial that best fits the distance-time data. Doing this for the ping pong results gives s = 4.50 t2 + 0.64 t - 0.0003. That makes gravity 9.0 m/s2, not bad for one run of the experiment. Repeat runs and averaging the results might well improve the experimental precision.
Notice too how the cotton wool ball takes longer to fall through the same distance. We could perhaps look up some formulae for aerodynamic drag on the web and see if the cotton wool results are in agreement with the theory.
Here are some points to bear in mind if you decide to build your own dropper.
- The example illustrated here would be ambitious for a four day activity. You might wish to simplify it. The essentials would be a motorized release assembly of some kind, and sensors to measure the distance-time profile. Sensor positioning and ball return could both be manual. Without the automatic return mechanism, you could increase the distance over which the ball drops, which should improve the experimental precision (think about it). With a longer fall, you should also be able to better observe the effects of aerodynamic drag. See the decidedly decent dropper for an example of this sort of simplification.
- In this example, the flight time is measured between the light sensor and impact. An alternative would be to measure the time between release and the light sensor. Think about the relative merits of these two approaches.
- Without the constraints of an automatic return mechanism, you could consider dropping a wider variety of objects of different shapes, to learn about their different drag characteristics.
- Think carefully about the accuracy and precision of your results. In the graphs above, there is clearly something wrong in that the cotton wool appears to fall faster than the ping pong ball initially. What we should really be doing is estimating the tolerances on our measurements (both distance and time) and putting error bars on the graphs.
- The Python software required to control the dropper should not be problematic. You just need to drive motors in sequence through predetermined angles, and read sensors and timestamps into lists. You have seen all that is required in the first session. Slightly more complicated is the process of analysing the results. Below, you will find some hints and a screenshot about measuring time intervals from sensor traces.
-
If you do attempt an automatic return mechanism, you might like to
improve the design shown here, which was not particularly reliable.
Here is an
 mpeg movie of a less successful run!
| Some annotated photographs | |
|---|---|
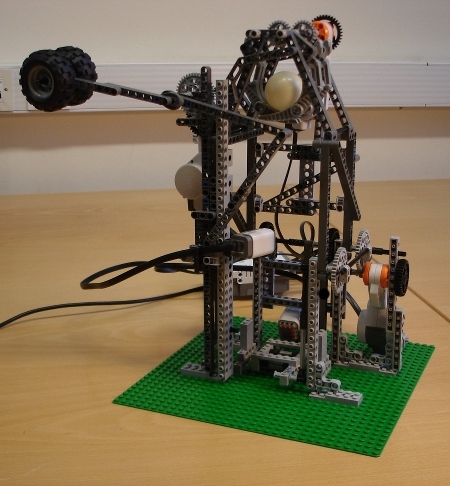 | View from the front. A ping pong ball is in the jaw assembly at the top, ready to be dropped. The light sensor is about half way up the tower: it will detect the ball as it passes. The microphone at the bottom will register the moment of impact. The light sensor is mounted on a kinematic mechanism that produces vertical translation up and down the left pillar. The wheels act as a counterweight. |
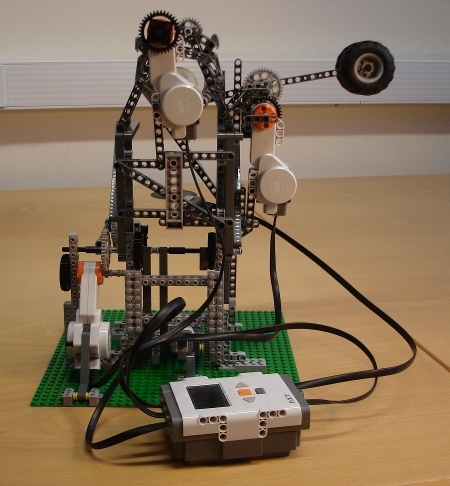 | View from the back, showing all three motors: (from top) jaw assembly, light sensor and catcher. The latter two are geared down 5:1. |
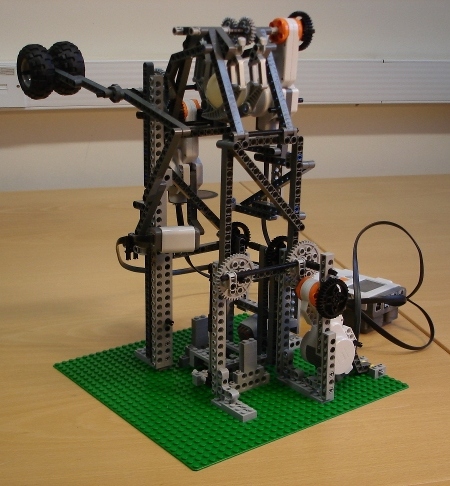 | View from the right, showing the catcher drive train. The ball is caught in the catcher and returned to the top, ready for the next run of the experiment. |
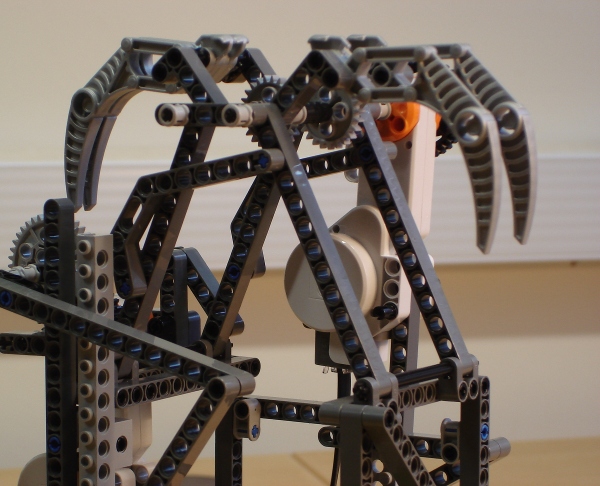 | Close-up of the jaw mechanism, with jaws in the open position. |
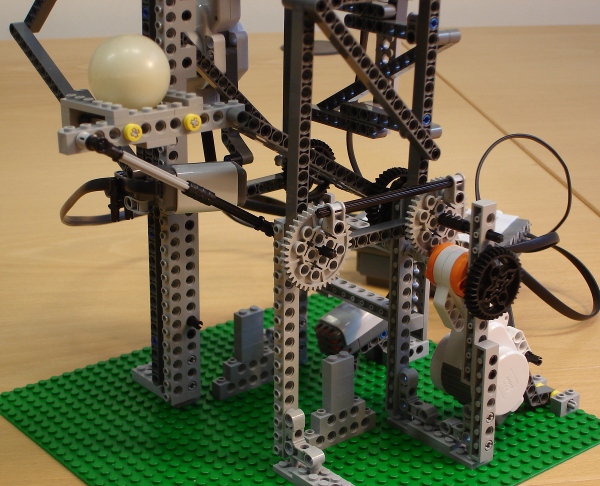 | Close-up of the catcher mechanism. Note how the light sensor arm has been driven out of the way, to allow the catcher to pass by safely. |
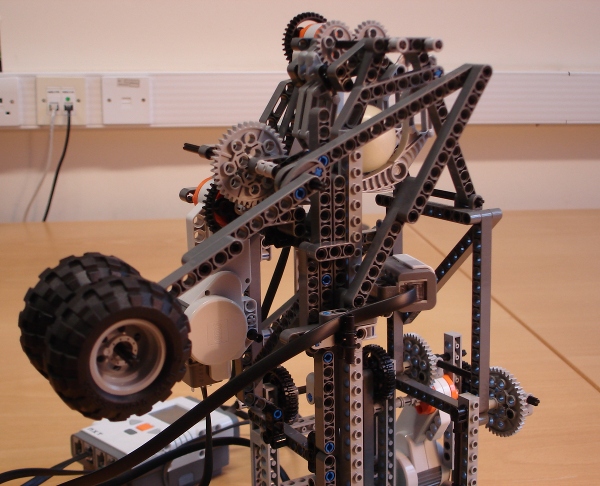 | Close-up of the light sensor mechanism. |
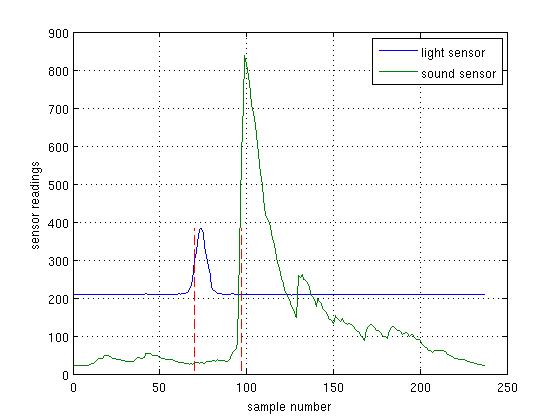 | This is how the flight time is measured. The ball is easily detected by both the light and sound sensors. The dotted red lines are positioned at the mid-points of the two transients, i.e. where the graphs pass through 0.5 * (min + max), but you could just as well use the peaks. The time the ball took to travel between the light sensor and the bottom is then given by the gap between the dotted red lines. Code for doing this is provided in example_4.py (programming examples on Moodle). The graphs were recorded over one second with a sampling rate of around 240 samples per second. |
The dazzlingly didactic dropper was designed and built by Graham Treece in December 2009.