The slippery shear box
 Geotechnical Engineering is a branch of civil engineering that concerns the behavior of earth: sand, silt, clay etc. The
  direct shear test is one of the more common procedures carried out by geotechnicians; students who go on to study Geotechnical Engineering in Part II will learn about this in some detail. The test apparatus can be used to find several key properties of the soil, but in this experiment the objective is to show qualitatively the relationship between the normal stress on a soil sample and the
  shear strength, and thus illustrate the soil failure criterion. With this understanding, an engineer can predict when the soil will fail and hence design structures safely. A summary of the relevant theory can be found
  here.
here.
Below is a series of photographs and plots showing the construction and behaviour of the model. There is also a  movie of the model in action. Some parts of the model are under considerable mechanical stress, so a lot of the challenge is making sure that your construction is as robust as possible. Complete software for operating the model is available
  here.
here.
| Some annotated photographs | |
|---|---|
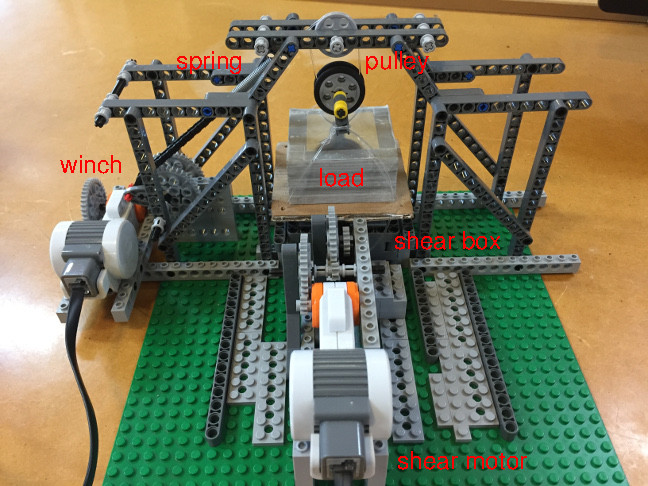 | This photograph shows the fully assembled model. The shear box in which the "soil" sample is placed is driven by the motor in the foreground. The motor on the left operates a winch which varies the extension in the spring and hence changes the load applied to the top of the sample. The experiment proceeds as follows. With the spring's limits established, the load is lifted off the sample and the soil is agitated using small back and forth motions of the top half of the shear box. A load is then applied by reducing the extension in the spring. The shear motor runs, this time driving slowly in one direction to slide the top half of the box relative to the bottom. During the shear, the motor's speed is recorded. The cycle then repeats with the load being removed, the sample agitated and then a new load applied. |
 | This is the shear box in which your soil sample will be placed. The bottom half is two beams deep whereas the top is three, to allow for the lid through which the load is transferred. You should ensure that the shear box is as stiff as possible, so that the force is transmitted from the shear motor to the soil effectively. Talking of "soil", for this experiment you will actually use short-grain rice as a dry and tidy surrogate for soil! It may be worth lining the box with paper to stop the grains from falling into the holes. The shearing motion must be in one direction only, so you should constrain you box so that it cannot move from side to side or up and down. |
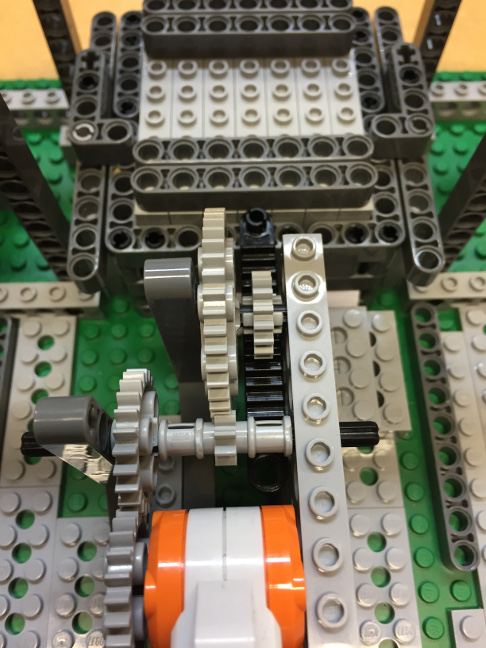 | This photograph shows the rack and pinion arrangement used to transfer drive from the motor to the shear box. The primary objective of the experiment is to measure the motor speed (and hence, indirectly, the motor torque) during the shearing operation, and to see how this varies with different normal loads. You will find that if you use too high a gear ratio, so that the motor speed is high and the motor torque is low, then changes in the stress at the shear box produce such small changes in the motor speed that you can barely measure them. So we suggest you start with a gear ratio of 5:1 and a fairly low motor power, say 20%. The change in motor speed you read is also very sensitive to the power your battery produces. If you run connected to the mains, you should get repeatable results but a small variation in motor speed. If you do not connect to the mains, the changes in motor speed may be more pronounced (because the motor power is lower) but harder to repeat consistently. |
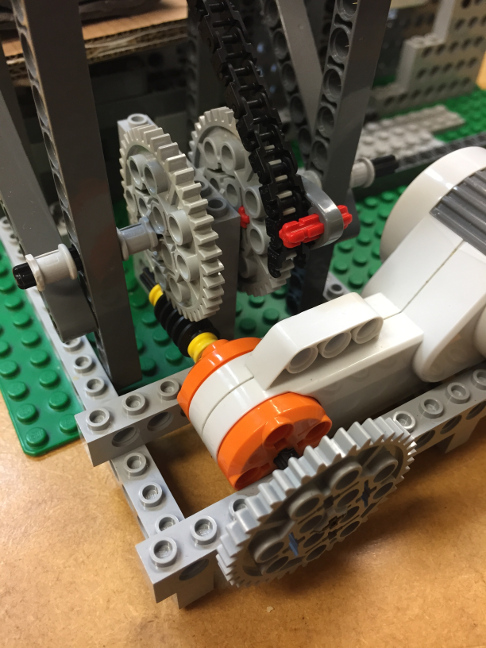 | This photograph shows the winch mechanism used to vary the normal load on the sample. A worm gear achieves the high force required to lift the load: it gives one tooth's movement for every full rotation, in this case multiplying the torque by forty. The chain is connected to one end of the spring which lifts the weight, thus varying the normal load. |
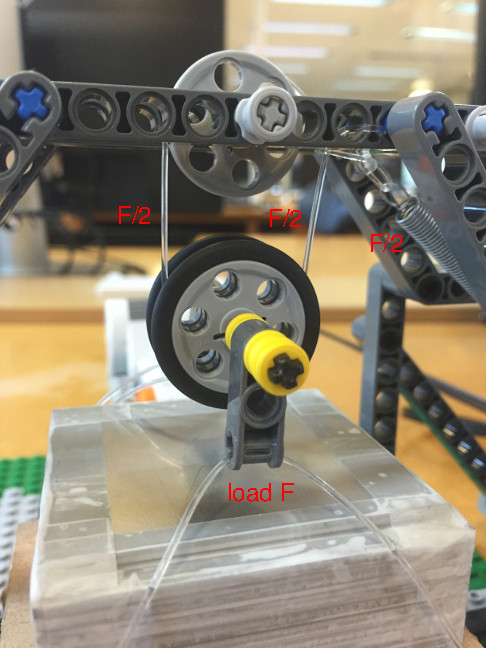 | The weight that you are provided is around 1kg, but 10N of tension will break the chain. So we use a pulley arrangement to reduce the tension in the spring and the chain by a factor of two. In this arrangement, the chain must withstand only half the normal load applied to the sample. |
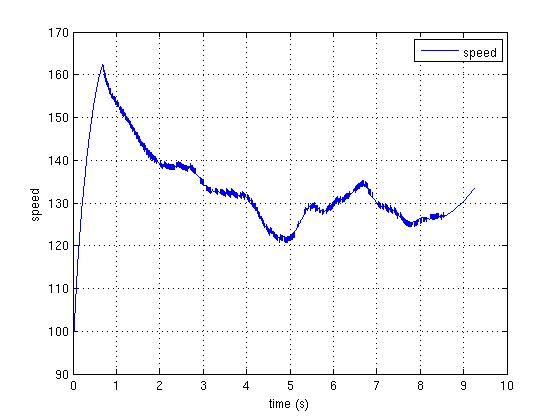 | This graph is an example of the variation in the motor speed during the shearing operation. After the initial, steep ramp-up, the motor slows down to a (roughly) steady speed as the failure stress is reached and the sample starts to shear. This steady speed is inversely proportional to the shear stress (since the motor speed goes down as the torque goes up) and is recorded by the software in the variable average_results. As a sanity check, you could run the experiment without rice (use the Lego wheels to support the lid) and you should find that the motor speed no longer varies systematically with displacement and normal load. |
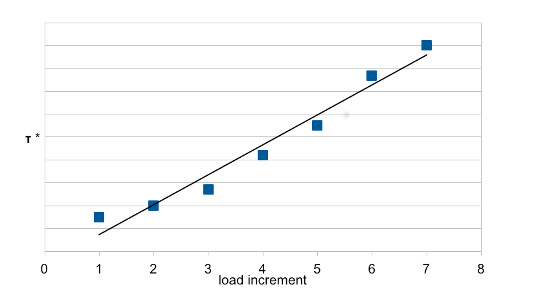 | This graph shows a plot of 1/motor speed, denoted τ*, against load increment, in this case averaged over ten runs at each normal load. Individual runs are somewhat variable, but averaging over several runs gives a good linear fit. We have demonstrated that rice is a frictional material and that, as expected, shear strength increases linearly with normal stress. |
Here are some points to bear in mind if you decide to build your own shear box.
- The size of the shear box can be varied. With a bigger box there will be a reduction in the "edge effects", so you may get more accurate results. A smaller box will give you a smaller cross-sectional area and therefore greater normal stress (load/area), which in turn might produce more defined changes in the motor speed. Try varying the size of the shear box and see what happens.
- A low shear rate would at first sight seem preferable, however excess gearing adds more backlash as well as giving very low motor torque, reducing the observable differences in motor speed. Can you find an optimal combination of gear ratio and motor power?
- The supplied code runs just once at each normal load. Adapt the code to make repeat runs at each load, then average the results to produce a less noisy relationship between τ* and load.
-
Can you calibrate the readings to produce quantitative estimates of the cohesion and the friction angle? This
 lovely website looks in detail at the NXT motors: of particular interest is
  this relationship between the rotational speed and torque of an NXT motor.
The slippery shear box was designed and built by Matt Parker in December 2014.