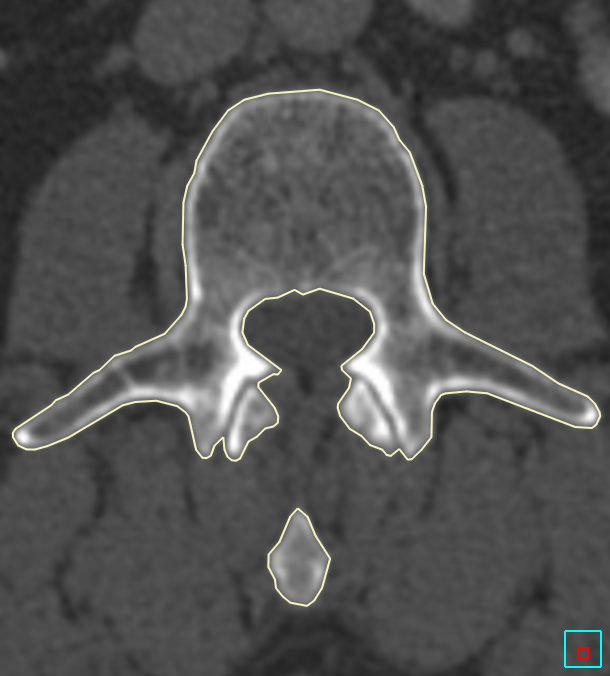
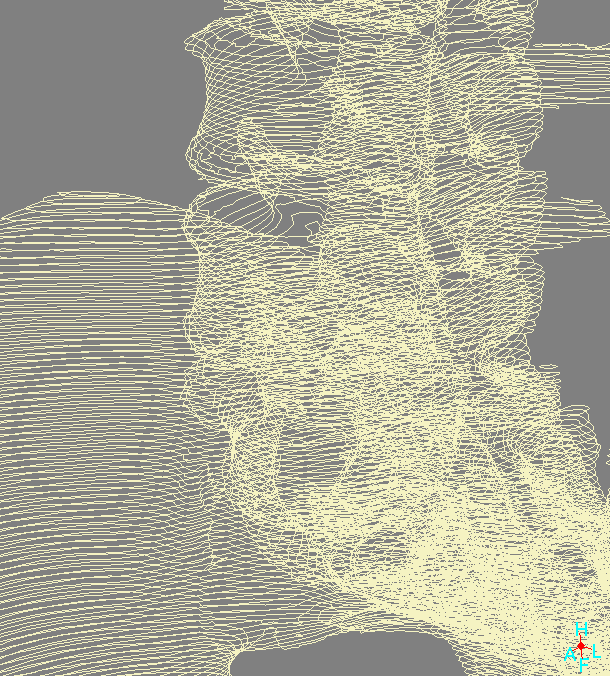
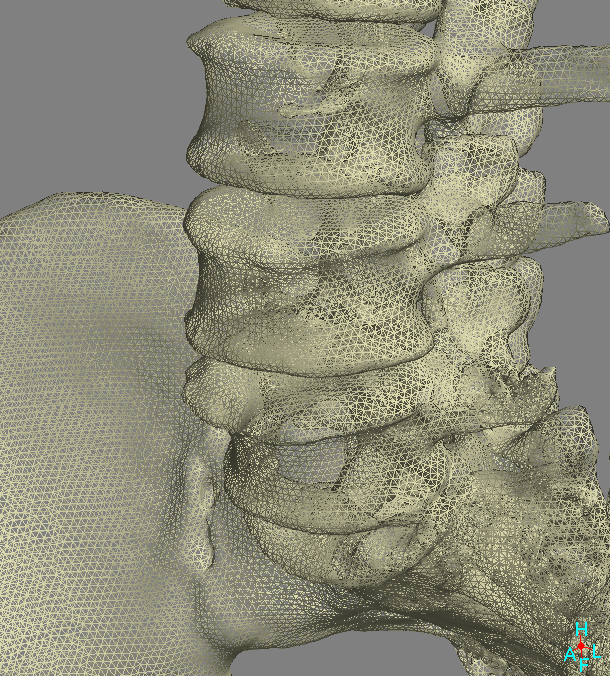
Surfaces of a desired object are created in Stradview in two stages. Firstly, 2D outlines are defined in the original images, which show the extent of the object in each of these images. Secondly, a 3D surface is created from these outlines. The outlines are poly-lines (sets of connected lines) which are saved in the Stradview file so that they are preserved for next time the file is loaded. The surfaces are triangulated meshes (sets of connected triangles) and, once created, can be exported to a standard 3D format which is understood by most 3D viewers. A previously exported (or externally created) surface can also be imported into Stradview. There are several reasons for this two-stage process:
Surfaces can only be created from 3D data sets, that is data comprising a set of cross-sectional images, for which the size and location of each image is known. For most DICOM data, and other typical 3D data formats, all this information is contained in the files and read in by Stradview automatically. However, if the data is stored as a sequence of images, then you will need to tell Stradview the size of each image and their locations before the data can be used to create a surface. This can be done using the image location configuration dialog. Otherwise you will be able to define outlines, but not create a surface.
Stradview can use the original image data to create outlines which are much more precise than the size of the image pixels, leading to surfaces which are accurate even when they are small relative to the size of the data. If the original data is binary (e.g. black outside an object and white inside an object) then this process is not possible, and the surface quality will be correspondingly reduced. Hence it is not usually a good idea to use external software to create a segmented volume, then load this data into Stradview to create a surface.
If the objects you want to segment have already been defined, then there are various ways of importing these in to Stradview objects. If you have a DICOM radiotherapy structure (RTSTRUCT) or segmentation (SEG) file which corresponds to the loaded image data, this can be imported directly. You can do the same with a NIfTI data file which contains an object (or objects) as binary label data, so long as it matched the loaded data. Alternatively, any loadable data set which is actually a set of labels can be loaded into Stradview as normal, and outlines can be automatically extracted which correspond to the boundaries of each of these labels.
If the data is very noisy, or the object you want to outline is very difficult to see, it may be necessary to draw outlines manually. There are several ways to do this (see the 'draw' task). You do not need to draw outlines in every image, in fact this will usually result in a poorer surface. Instead, draw outlines in the first and last image in which you can see the object, and as many in-between as you need to define the shape of the object. The surface creation stage is good at generating appropriate intermediate shapes between two outlines, so you only need to draw outlines where the shape actually changes. If you start with just a few, then you can go back and add further outlines later if you are not happy with the eventual surface.
For most data sets, it will be possible to create outlines using a data threshold, or level, even if some manual checking and editing are required later on. There are a variety of options, but this stage and subsequent surface creation usually only take a few seconds, so it is easy to iterate until you are happy with the results. The best approach is to try a few times with different settings until you have a surface which you are happy with before you start to manually edit any of the outlines.
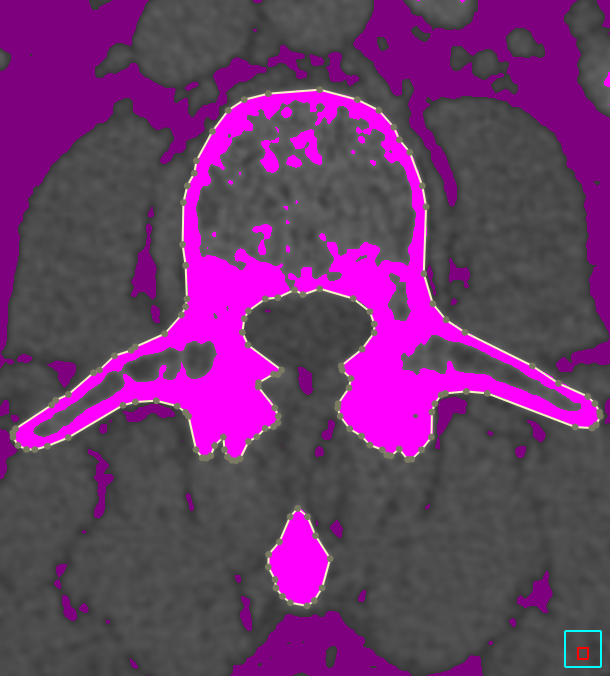
The data level is the most important parameter to get right. This can most easily be set by using the 'ortho' visualisation so you can see various slices through the data, then watching how the magenta region changes as you move the 'grey' threshold slider. This slider is in 8-bit 'brightness' units, so that zero is always black, and 255 is always white. This means that, for CT data, the level is also affected by the 'windowing', which changes the mapping between actual CT value and brightness. You will need to set this appropriately first to ensure that the edge of the object is clear, but that surrounding darker and brighter voxels are also visible so the entire blurred edge can be seen. The threshold is also displayed in the actual units of the data, just below the sliders.
You should aim to set the slider so as much of the object as possible is coloured magenta, but the slider value is high enough to avoid the noise: so there are no (or very few) magenta spots surrounding the object, and the edge of the magenta region is smooth and does not contain any small noisy outlier regions. For segmenting bone in CT data, this could be anywhere in the range 130 to about 160 HU, depending on the noise in the data. If this is difficult, you might want to smooth the data a little to reduce the noise, though Stradview can only do this with 16-bit data.
The 'not' slider can then be set in a similar fashion. Here you are looking for the darker magenta region to highlight any areas which are never contained in the object. You should find that there is a substantial grey region between these two thresholds which may occasionally contain parts of the object you want to create the surface of. For segmenting bone in CT data, this will probably want to be less than -50 HU.
Having set these thresholds, and selected an 'every frame' value greater than zero (and probably one), then clicking in a magenta region will create a set of outlines. See the 'draw' task for more detailed help with each of the following options, and what effect they each have, but the settings to try first are:
You should then create a surface (you may need to click on several different regions first if you are segmenting the whole skeleton), at the highest resolution if you want to see all the details, and have a good look at the results to see whether any of these controls need to be tweaked:
Selection of the 'every frame' slider depends a lot on the resolution and size of the data set, and complexity of the surface you are creating. If you find you are creating many nearly identical outlines, then you should increase this value. In addition, there is always at least one layer of triangles in the surface between each pair of outlines: so if you use a low surface resolution, but also a very low frame spacing, you may end up with triangles with poor aspect ratio. You can investigate this with the 'L' key in the 3D window.
Manual editing of the outlines should only be started once you are happy you have the best possible automated surface. If you are going to need a lot of manual editing, then you should minimise the number of outlines (larger 'every frame' value) and also the number of points in each outline (larger 'contour accuracy' value), whilst preserving the accuracy you need in the surface. Both of these changes will make any manual editing easier. The various options for manual editing are detailed in the 'draw' task, and include editing of individual outline points as well as merging of parts of automated outlines with parts of manually drawn outlines. This is all achieved in the 2D image window.
Sometimes the automated approach will generate a good set of outlines for the object you want (for instance an individual bone), but will also segment many objects you do not want (perhaps the remainder of the skeleton too). Usually the best way to solve this is to first review the outlines in the original images, ensuring that you have separated the desired object from any surrounding objects. Stradview has various tools for splitting outlines in this way. Having done this, you can use the 'erase' tool in the 3D window on the outlines. Either select any outlines which you do not want and delete them, or select the outlines which you do want and transfer these to a different object. Then you can delete the original object to remove all the others.
You could alternatively segment every thresholded region in the data set ('connected region only' not ticked), and then let Stradview split up the results into separate objects by choosing a number of objects greater than zero with the 'split into objects' slider. If you then 'update' all of these objects to create surfaces, you can again use the 'erase' tool in the 3D window to select any of these objects you want to delete, or select which ones you want to combine into the same object.
If the data is very noisy, so that the edge of the segmented region is quite rough, it may be worth smoothing the data first. This is possible by increasing the filter extent above zero, within the Image display controls. Smoothing is performed dynamically as the data is viewed, so it is usually better to adjust this slider with all the lower reslice visualisations blanked, then view them again after deciding on an appropriate filter value.
Alternatively, if the automatic approach generates a reasonable surface in many places, but considerable manual editing is required to get the surface right, then it may be better to use a shape model to help segment the data. Currently, shape models are available for the proximal and distal femur, the otic capsule in the ear, and the talus. However, Stradview can also make use of any surface so long as it is in an appropriate format with several landmarks defined.
For a guide on using a shape-model to create outlines, see the the 'shape model' How-To. The idea is that minimal further manual editing should be necessary, though it is still possible to edit the outlines generated by this process.
Having created the outlines, these are saved in the Stradview file and will be loaded next time the data is opened. In contrast, the surface needs to be created from these outlines each time the data is loaded, but this can be done simply by pressing the 'update all' button. The surface is formed by interpolating distance transforms of the outlines, which preserve the sub-pixel precision of the outlines, but create gradual changes in shape between each pair of outlines. This interpolated data is iso-surfaced using Regularised Marching Tetrahedra, which again preserves precision, but creates a triangulated mesh with very uniform triangles. There are a few options detailed in the 'draw' task, but of these, the surface 'resolution' and 'smoothing strength' are the most important.
The 'resolution' sets the average size of the triangles which make up the surface. Since all triangles are planar, this also controls the precision of the surface. It is easiest to see the effect of this by using the 'L' key in the 3D window. Higher resolution may also make the surface take longer to visualise, and will increase its size when exported to a 3D format. Nevertheless, you will only see all the detail, for instance in a bone segmentation from CT, if you use the 'very high' resolution value. In general, you should pick the lowest resolution which nevertheless captures all the details you require in the surface.
The 'smoothing strength' is useful if the data is not very clean, and the surface looks noisy (not very smooth). You should set this to the lowest level necessary to remove such noise in the surface.
Once a surface has been created, it can be seen in the 3D window, presuming the opacity has not been set to zero. It is sometimes easier to manipulate a surface in this window if the centre of rotation is about the centre of that surface: this can be achieved by using the 'find' button in the 'draw' task. This button also aligns the ortho visualisation with the surface, which makes the intersection of the surface with the data clearly visible. Setting the zoom appropriately, and locking it so that it is the same in all windows, then using 'find' on the surface, can hence be used to check it is a good segmentation of the data.
Display of the surface can be changed using the material properties in the draw task page: as well as the colour, the metallic, roughness and anisotropy sliders change how the surface is drawn. These will only have an effect if your display driver at least supports OpenGL 3.0, and you have selected either the Cook Torrance or Phong shaders. There is also a 'clear phong' shader which is useful for visualising hidden surfaces, or the thickness if you have used CBM to create inner and outer surfaces.
In the 3D window, you can also measure surface properties, place landmarks on this surface and draw on it in order to create surface patches. It can also be saved for visualisation in external 3D viewers, or used to generate measurement data (by saving to a text or csv file). However, you can also use the surface to generate a cropped data set: the visualisation windows have 'crop to surface' options, which only display data either inside or outside a surface. This feature also affects what data is exported when using 'export voxels'. If a surface has been created before using 'export voxels', the new data set will also contain a set of outlines which correspond to this surface, but are aligned with the new exported data.