Current Research
- Examples of 2D deconvolution
Examples of 2D deconvolution
Clinical ultrasound images are often perceived as difficult to interpret due to image blurring and speckle inherent in the ultrasound imaging. But the image quality can be improved by deconvolution using an estimate of the point-spread function (PSF).
In the following, we demonstrate the capabilty of our deconvolution alogrithm especially in the 2D medical ultrasound images. The examples of 3D deconvoltion can be found later.
Simulation
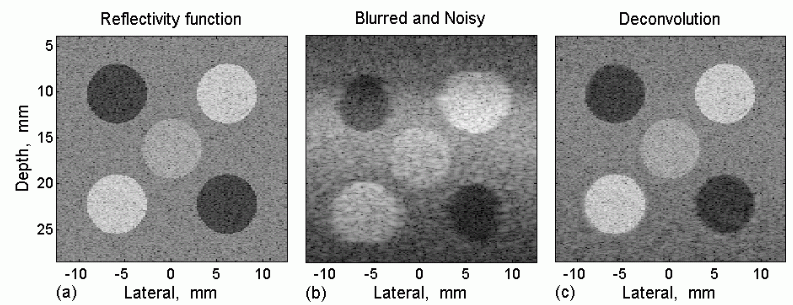
The simulated reflectivity function in the left is convolved with a PSF into the blurred and noisy image in the centre. The same PSF used for the blurring was also used in the deconvolution in the right. A considerable degree of restoration is observed. The cysts appear, once again, as circles with sharp boundaries. Furthermore, the speckle size is significantly reduced, but the speckle is retained, which is important as this textural information can be usefully interpreted in clinical applications.
In vitro phantom
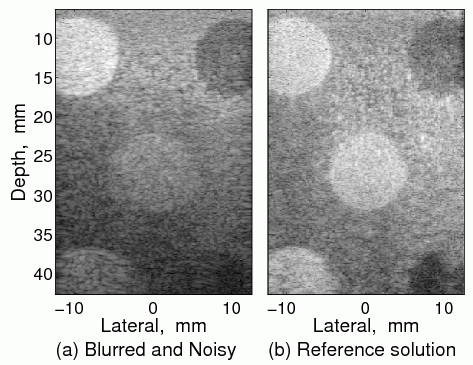
Figure shows the ultrasound image acquired in vitro and its restored image using an estimated PSF. The deblurring is evident and the cysts recover their original shape with a well-defined boundary, and are hence distinct from the background. The physical size of the speckle is notably reduced as well.
In vivo forearm
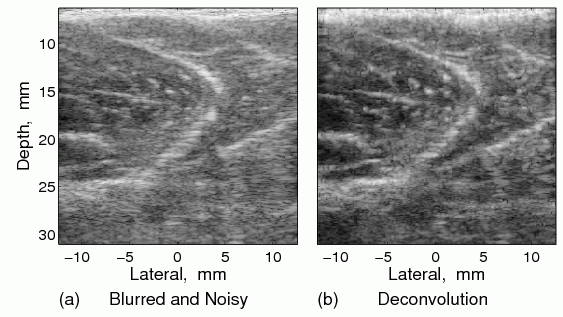
A clinical ultrasound system was used to scan a left forearm, near the elbow. Figure shows the acquired in vivo ultrasound image and its restored version using an estimated PSF. The physical size of the speckle is reduced and deblurring is evident, especially in the dominant curved feature.
PSF sensitivity
In a non-blind deconvolution of medical ultrasound images, it is often difficult to obtain a sufficiently accurate estimate of the point-spread function in vivo because of the unknown properties of the soft tissue in clinical applications. Therefore, we have explored the sensitivity of our deconvolution algorithm to uncertainty in the point-spread function (PSF).
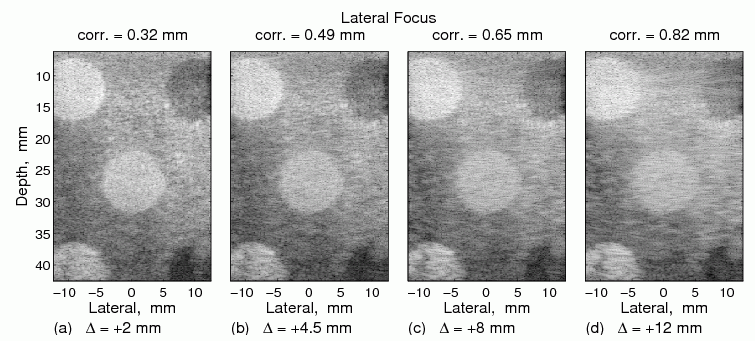
Sensitivity analyses have been conducted to 2D deconvolution while varying six parameters on which the point-spread function depends. Uncertainty in the ultrasound machine is analysed by varying the axial depths of lateral and elevational foci alongside height and width of transducer elements. Sensitivity to tissue influence is investigated by varying the speed of sound and frequency-dependent attenuation of the electro-mechanical impulse response. The Figure below shows how the results of deconvolution are affected when wrong lateral foci are asssumed.
Among these six parameters, we have discovered that the two most critical parameters for 2D deconvolution are the lateral focus and the speed of sound, because the success of deconvolution is perceived primarily in terms of deblurring.
Finally, we have shown that it is possible to restore in vivo ultrasound images using an assumed point-spread function and hence conclude that an exact point-spread function is not necessary for enhancing ultrasound image quality by deconvolution. The example of this finding is shown in the case of "in vivo forearm" illustrated above.
Estimation of the speed of sound: homogeneous media
Numerous measurement techniques have been proposed to estimate the speed of sound in the medical ultrasound applications. Most of them require multiple transducers separated with a known geometric relationship, the movement of transducers or the multiple scans of the region of interest. However, such requirements cannot be carried out through a conventional use of a single linear array and hence often leads to a special rig for the job.
During the course of the project, we have developed a technique enabling the estimation of average speed of sound in which a conventional use of a linear array is all required in the data acquisition aspect: in other words, the data can be collected freehand.
We have applied our deconvolution algorithm for the estimation of the speed. In our PSF sensitivity investigation briefly outlined above, we have found that it is possible to identify the correct parameter of a PSF (which is the speed of sound in this case) through the deconvolution. Once a parameter in question is close enough to the true value, the perceived images may not be distinguishable to human visions (which is also a major findings of the work), however, they still return minute differences in other metric such as correlation. We have compared those correlation values between deconvolution by different speeds of sound and been able to detect the correct value.
Aside from estimating the value of the sound speed, we also put an equal emphasis on the concurrent correction of speed-of-sound in ultrasound images by our deconvolution method, as demonstrated in the Figure below. Such simultaneous capability of estimating the speed and correcting its effect in ultrasound images has not been demonstrated in most of techniques published previously.
Figure in the above provides the evidence of a further enhanced image by restoration with an optimum speed of sound. The left sub-image is the original ultrasound image acquired by an ultrasound system whose beamforming delay is set to the sound speed of 1540 m/s. The middle is the restoration by a correct speed of sound (1455.89 m/s) estimated by our algorithm. The right is the restored image by the PSF having the speed of 1540 m/s. It is clear that the deconvolution result via 1540 m/s has smaller speckle sizes and smaller footprint of a wire in the centre than those of the original image. However, it is observed that the deconvolution image by a correct speed of sound has the best quality: the wire at the centre is restored to its original circular shape, and speckles in the surrounding area are clearly smaller than those from both the original ultrasound image and the deconvolution by a nominal speed of 1540 m/s.
Estimation of the speed of sound: dual-layered media
We have extended the above speed-estimation technique to dual-layered media. The same deconvolution algorithm has been used for both homogeonous and dual-layered media. The main difference between the two scenarios lies in the PSF used for deconvolution. For dual-layered PSF, an ultrasound simulator has been developed.
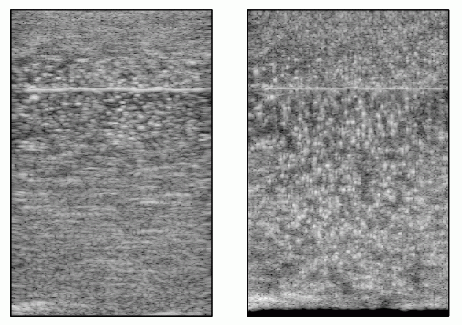
Figure in the above shows a deconvolution result of a dual-layered in vitro phantom. The left image is the original ultrasound image acquired by an ultrasound system. The right is the restoration as a result of our dual-layer speed estimation algorithm. The estimated speeds are 1550 m/s and 1496.25 m/s for the top- and bottom-layer respectively. One can also notice that the boundary line gets thinner as a result of deblurring in deconvolution, which may indicate that the amount of true reflection might not be as much as judged in the original image. An intriguing aspect about the boundary lines is that they seem to be tilted after deconvolution, but this appears to be an optical illusion upon closer inspection. The black strip towards the bottom of the restored image occurs because the sound speed used in the lower layer of the PSF is slower than that of the upper layer. In ultrasound imaging, slower sound speeds tend to make scatterers look longer in axial dimension, and therefore a deconvolution process restores the phenonemon and results in reduced scales.
Examples of 3D deconvolution
Under construction ...


