Dr Graham Treece, Department of Engineering
F-GMT11-1: Computer graphics: multi-parameter visualisation on a 3D surface.
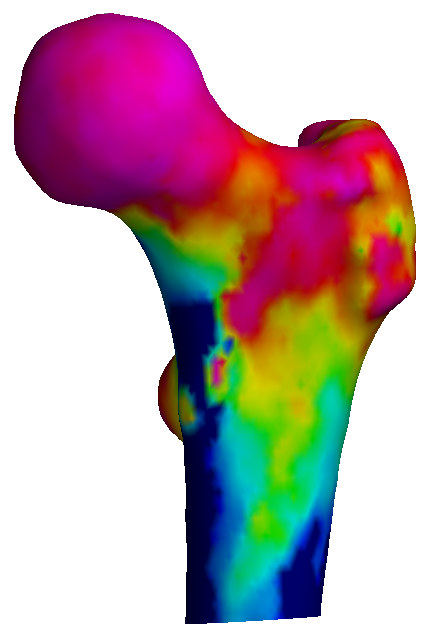
 The most straightforward way to show a single parameter mapped over a surface is to use colour to display it: here the colour shows the thickness of the outer layer of bone (cortex). |
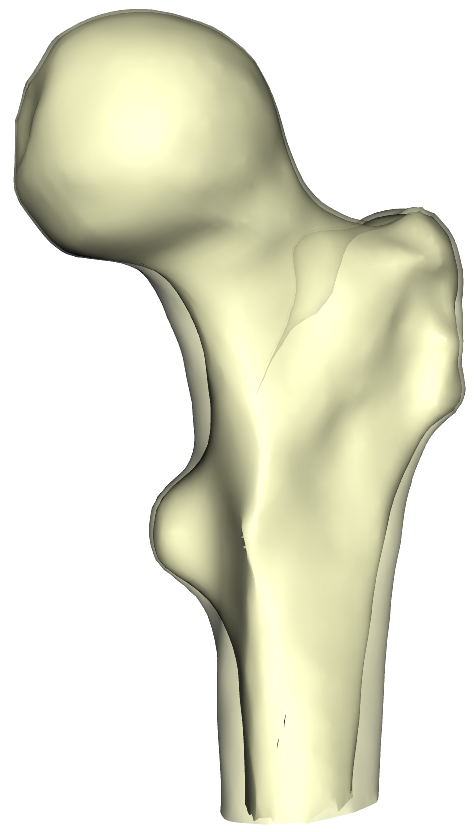
 You could also display the same information as two surfaces (inner and outer) rendered slightly transparent. This gives a more physical sense to the data, but you can only see it at the edges. |
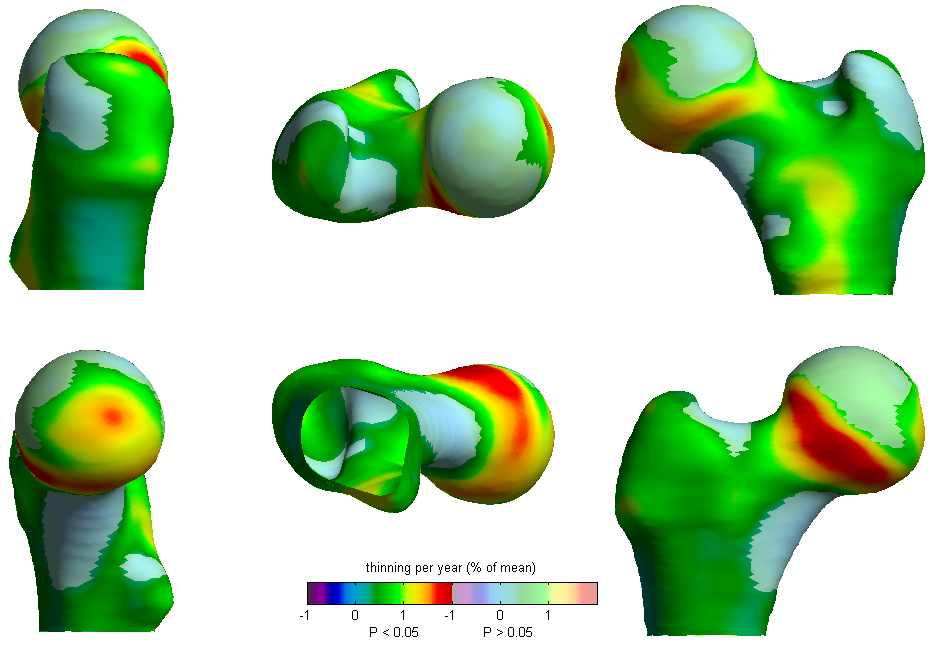
 Here we want to show two parameters: thickness, and also statistical significance. This attempt to used washed-out colours is only capable of showing binary significance values (i.e. yes or no) at the same time as thickness. What if we have more parameters we want to display? Just how much can be successfully visualised at the same time? |
- Graham Treece
- Introduction
- Teaching
- Research
- Publications
- Software
- Videos
- Personal
- Medical Imaging Group
- Overview
- Members
- Projects
- Research Opportunities
- Free Software
- Machine Intelligence Homepage
